Day 031 - Checkboxes and crosstabs
Resuming on page 336 of the tutorial, I proceeded to add a check box to the report. Naturally since this is a report the check box is just a way to graphically display a true/false value, and as the tutorial indicates they can be used to reproduce preprinted forms.
The purpose of this particular checkbox was to indicate whether a customer was registered. I added a control to the report's only break header (so it would be displayed along with the company information, also in the break header), and then I used the control's properties to associated it with a field in the Customer file. I assumed that field was a boolean, but I wanted to be sure and I wanted to have a look at the raw data.
Checking the file definition was easy - the analysis showed me that the field was a 1-byte signed integer:
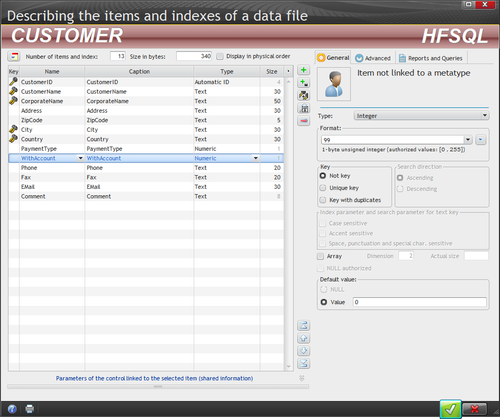
HyperFileSQL does support the Boolean type, but that's not in use here.
I also wanted to have a look at the raw data. Although I got to the above window by clicking directly in the Analysis pane, I didn't have the analysis itself open. I opened it, and used the context menu on the Customer file:
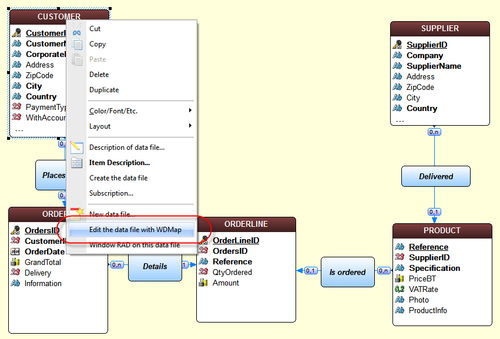
I used WDMap (odd name, perhaps a mis- or non-translation from French?) to view the raw data:
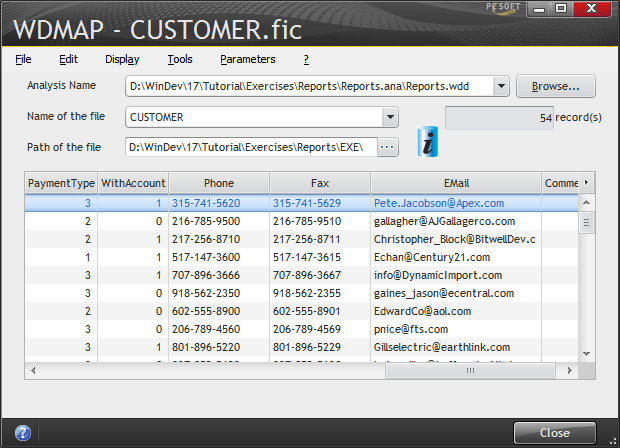
So yes, I did have some 1s and 0s in my data file, and this was corroborated by a test of the report (have I mentioned lately how nice it is to be able to test queries, reports, windows etc without launching the app?).
Crosstab reports
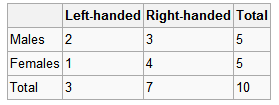
WinDev has support for cross tabulation reports, also known as pivot tables. If you're not familiar with the term, you're still almost certainly familiar with the result. There's a simple example of a crosstab on Wikipedia, which considers a data set of male and female subjects and their left- or right-handedness. The resulting crosstab looks like this:
WinDev crosstabs are always based on embedded queries, not reusable standalone queries.
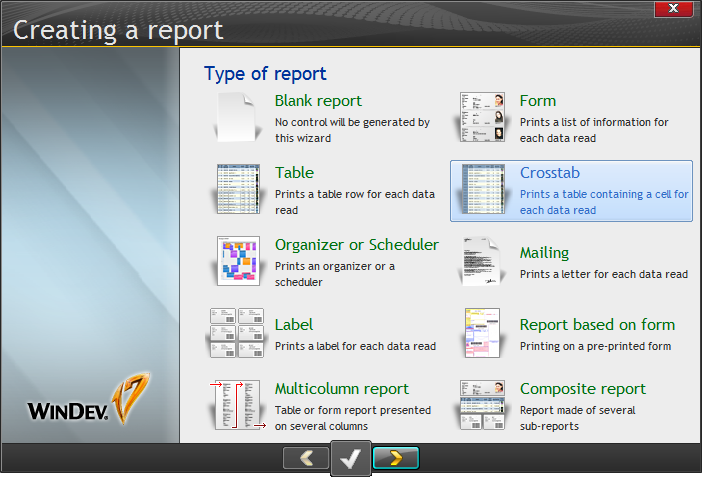
I opened the crosstab wizard:
Step two was to set the columns:
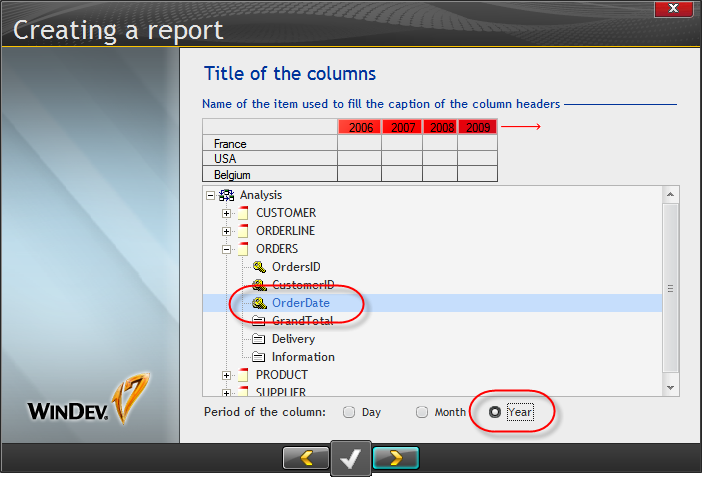
I didn't bother setting minimum and maximum dates but went on to the row data:
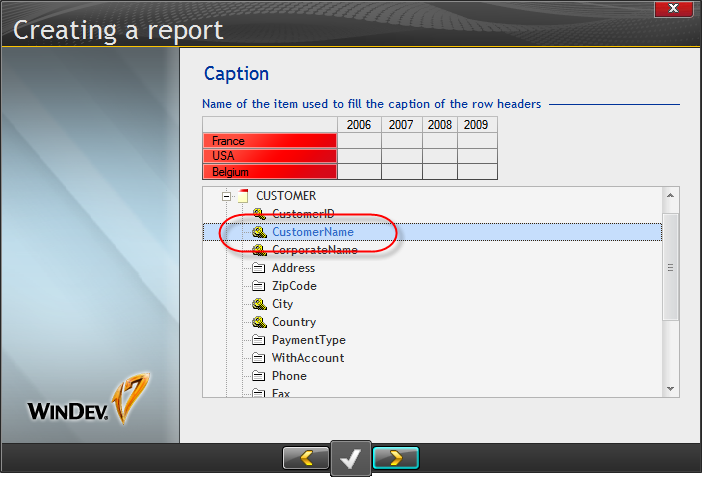
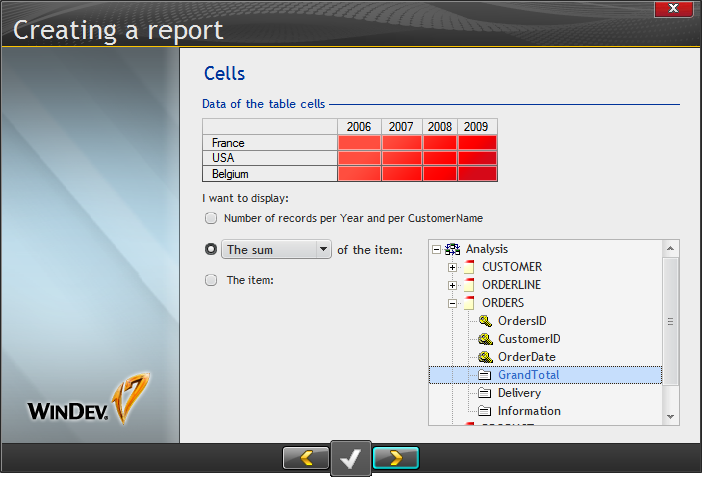
At this point I knew I was going to be showing some customer-specific data, accumulated on a yearly basis. The tutorial told me to choose the GrandTotal item in the Orders file and do a sum.
And finally grand totals:

The result was the following report, as shown in the previewer.
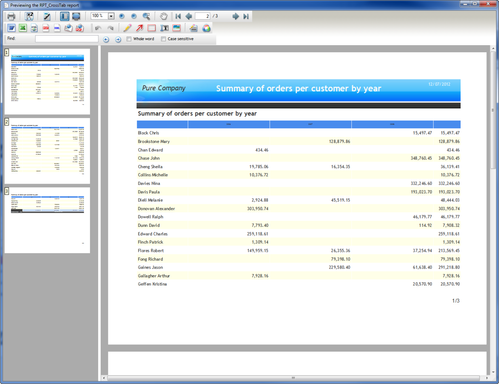
I didn't quite follow the instructions and made it a landscape report instead of reducing its size, so I wondered what would happen when I changed it back to portrait:
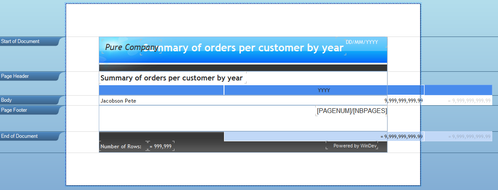
The automatic resizing apparently only applies in the wizard.
It was quite easy to resize the columns since this appears to be a table-style report, where the columns aren't actually free-standing controls. Move one column's border and everything else adjusts. But I did notice that with three years worth of data, if the totals column wasn't big enough the data displayed as +++ ++. And although the total column properties indicated it was fixed width, it did appear to resize. I can see how you'd probably want to restrict the number of columns in a crosstab report by paying attention to ranges.
Other than possible formatting issues, basic crosstabs in WinDev are simple and easy.
I'll resume Monday with special report controls. Tomorrow I'll be presenting DevRoadmaps on WxLive!