Day 042 - Charts and a suggestion for complex menus
I spent a bit of time working my way through the chart tutorial, which asked me to create a chart control.
When you drop a chart control on a window you get a wizard, which first asks you what kind of chart you want to create:
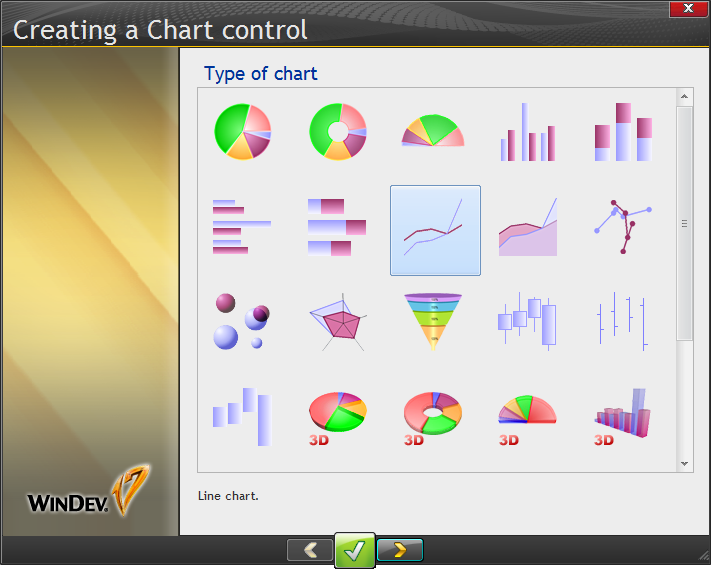
I stuck with the preselected line chart.
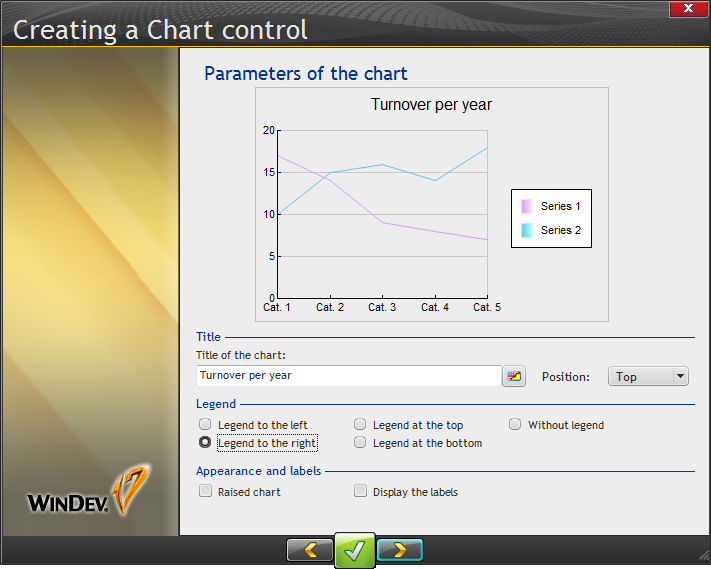
Next up, some descriptive stuff:
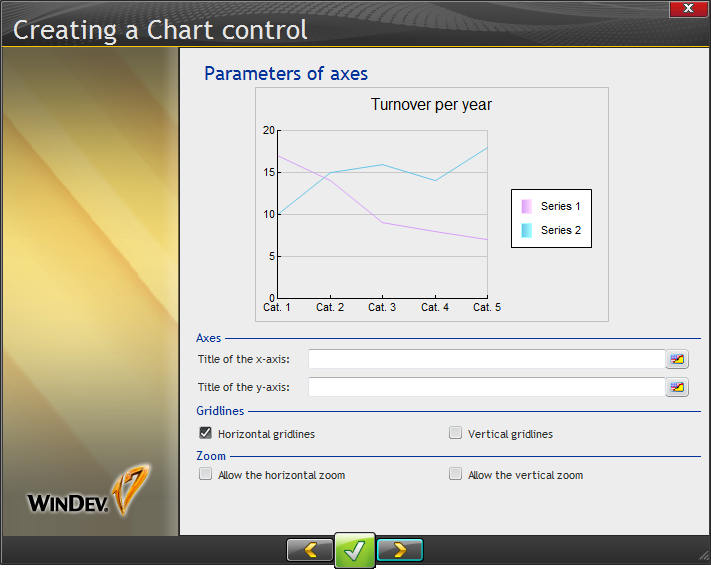
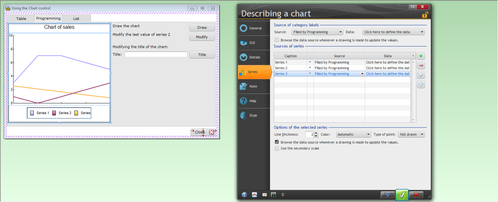
On the next page I accepted the defaults:
And then I had to choose the data. Here I got a little confused.
First, I set the source of the category labels to Browsing a file or query and the Data to QRY_TO_per_year.Year.
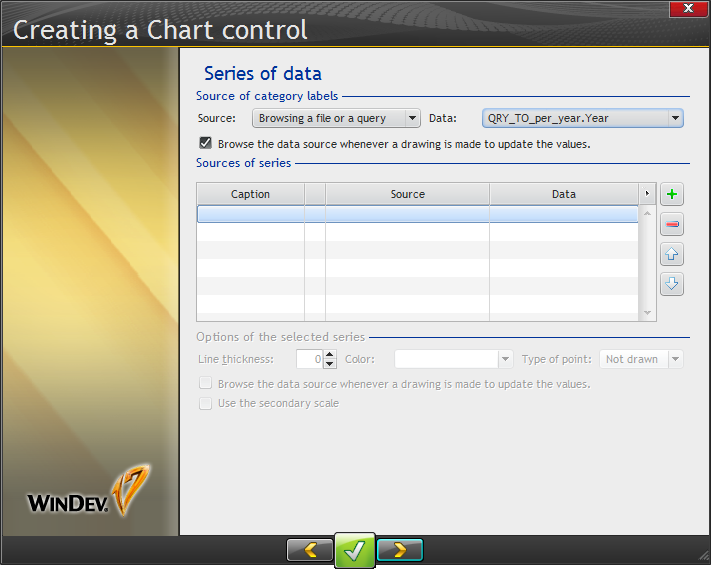
Point 6 on page 395 says "Indicate the series of the chart. In our case, we will be using a single series."
I really didn't know what that meant. But the tutorial screen shot showed a line of data, so I clicked on the + button. Which I probably didn't need to do.
Instead, I think I was meant to click on the empty line, which is what I did the second time I went through chart creation.
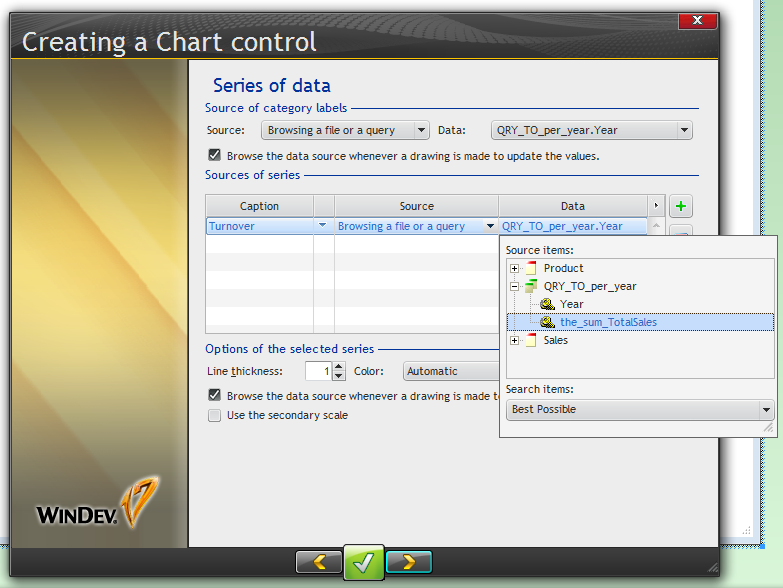
I selected the Total Sales for the series. And that was pretty much it. I ran the window and saw my chart:
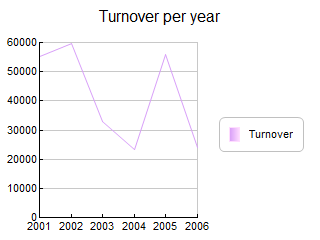
Not very difficult at all.
You can also create charts programmatically. Here things get a little funkier, at least in my opinion.
I had a look at the source for the chart demo, which displays one of three charts, the first being this one:
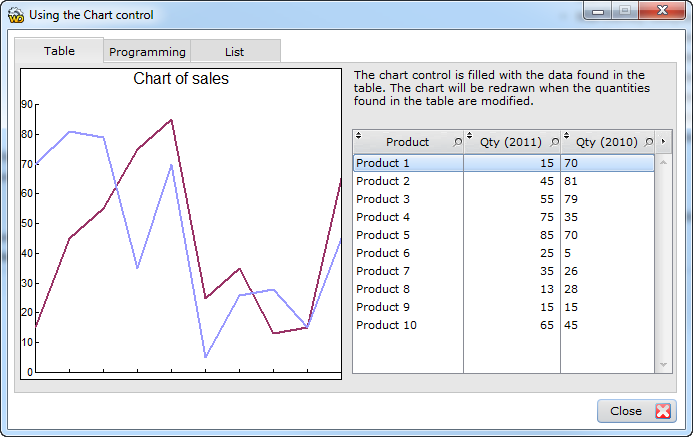
Here's the code that draws the chart:
TableAddLine(TABLE_PRODUCTS,"Product 1",15,70)
TableAddLine(TABLE_PRODUCTS,"Product 2",45,81)
TableAddLine(TABLE_PRODUCTS,"Product 3",55,79)
TableAddLine(TABLE_PRODUCTS,"Product 4",75,35)
TableAddLine(TABLE_PRODUCTS,"Product 5",85,70)
TableAddLine(TABLE_PRODUCTS,"Product 6",25,5)
TableAddLine(TABLE_PRODUCTS,"Product 7",35,26)
TableAddLine(TABLE_PRODUCTS,"Product 8",13,28)
TableAddLine(TABLE_PRODUCTS,"Product 9",15,15)
TableAddLine(TABLE_PRODUCTS,"Product 10",65,45)
// Redraw the chart
grDraw(MyChart)
grDraw is a standard graphics function.
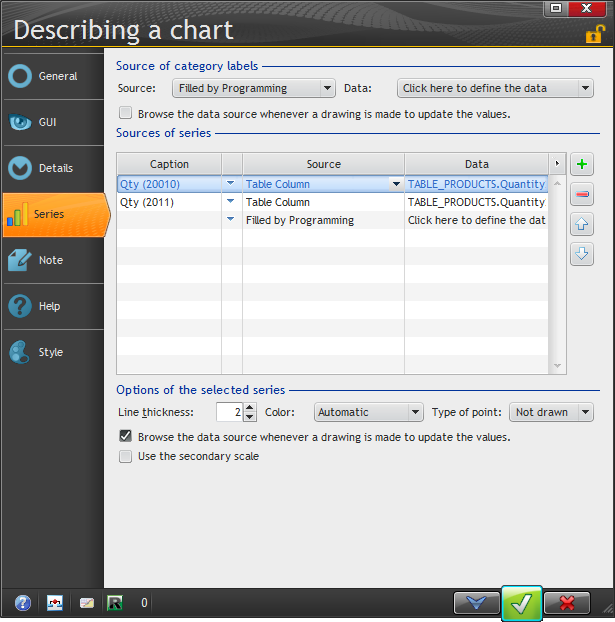
I looked in the source code to see where the connection might be between TABLE_PRODUCTS and MyChart, but there was nothing to be found. And I suppose I'm betraying my Clarion-centricity here, because WinDev doesn't show you all its code (or if it can, I don't know how to make it do that).
The connection is defined in the chart's properties:
There's another chart which has three series of data:
The code to assign the data looks like this:
// Local variables
	SerialN is int		// Series Number
	NValue is int		// Number of the value
// Browse the series (create 3 series)
FOR SerialN = 1 TO 3
	// Browse the values (create 25 values per series)
	FOR NValue = 1 TO 25

		// Add a data to nSeries
		// The series are defined in the 7-tab window
		MyChart_Prog[SerialN][NValue]= Random(1,50)

	END

END
grDraw(MyChart_Prog)
In this example the chart object is called MyChart_Prog. I find it interesting and, well, a little strange that I can set the chart's data as array properties on the chart itself.
A digression
Yes, I got distracted again part way through this tutorial section. I recently reconfigured WinDev for multi-monitor display, and made the mistake of minimizing the window editor, which caused it to disappear under several other windows on another monitor. I eventually got it back but by that time I'd really mucked up the whole display, and I decided that maybe I really didn't like multi-monitor mode after all. But how to get everything the way I wanted?
Somewhere in the menu I found an option to restart the IDE configuration wizard, which did the job and got me back to a single-monitor layout.
But now that I come to write about it, do you think I can find that option anywhere?
Here's a thought: how about a searchable menu system? There are so many different options in the IDE that I really need some assistance finding my way around.
That would be a nice adjunct to any complex application, I think.