Resuming on page 83, I still have a few more tables to add. From the project dashboard I clicked on Analysis and then on Graph.
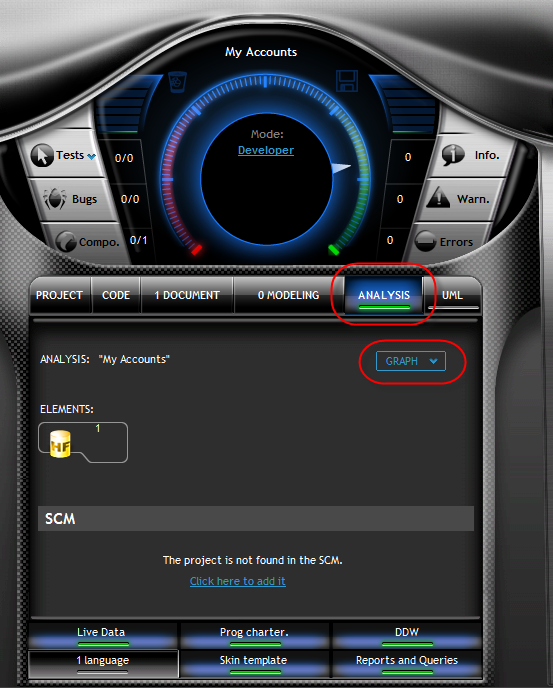
This brought up the graphical view of my analysis with the previously added file. I right-clicked in the blank space around the existing file and chose New data file....
| Info |
|---|
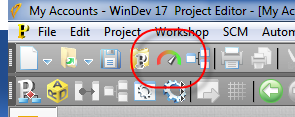
So far in my early experience with WinDev, I find there are certain windows I keep coming back to again and again. One is the project dashboard, which I usually reach via the toolbar:
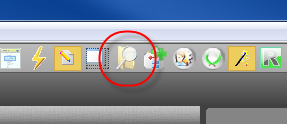
The other is the project explorer. It also has an icon, which on my toolbar is waaaay over on the right.
|
The second file in the analysis represents a Person, and among other things it has an Email field which I created using on of the meta types (as mentioned on Friday).
The tutorial instructed me to add the third file by using Windows Explorer to drag and drop the Banks.xml file onto the analysis. Only when I went to the designated directory there was no Banks.xml. I did see a Banks.csv. I did find a Banks.xml in my WinDev 16 directory tree. And then I remembered that I was using the WD 16 tutorial. I switched to the WD 17 tutorial which told me to drag and drop the CSV file not the XML file.
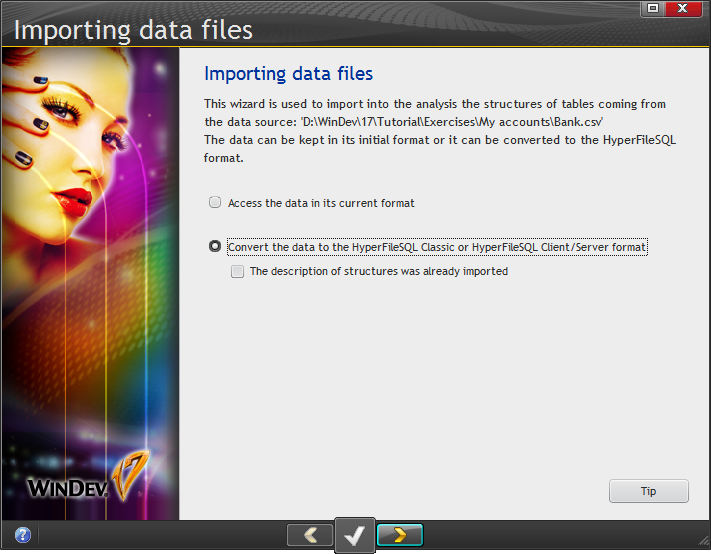
I converted the data to HyperfileSQL and imported the CSV file as a text file using these settings:
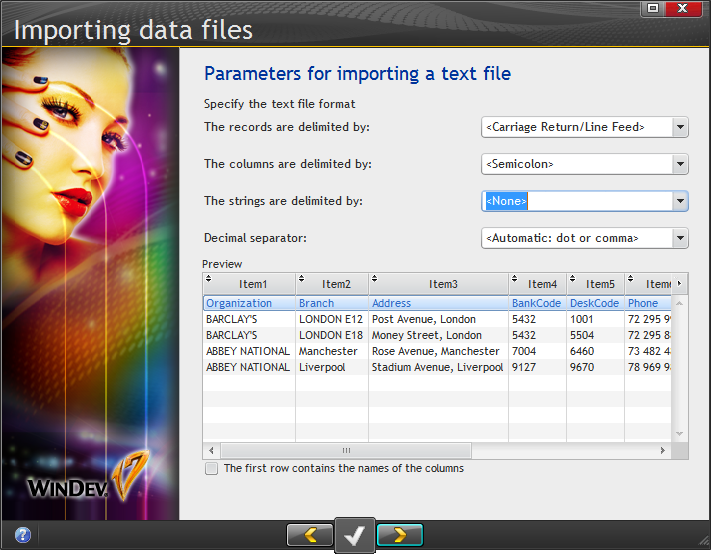
When I went to the next page I discovered I didn't have any column names specified; I'd forgotten to check the "The first row contains the names of the columns" option. When I did so I got the following:
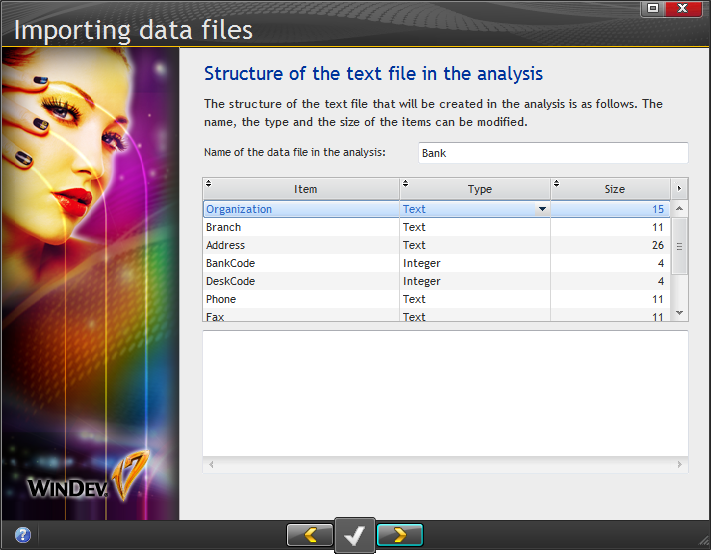
The column sizes appear to be determined by the longest string in the data, so I made a few column length changes per the tutorial's instructions.
I accepted the defaults for the database file location and saved my changes. Then I went to the file properties and made the remaining changes as instructed, which included ticking a checkbox for the addition of an automatically generated primary key, changing a field subtype and adding a composite key. I mentioned composite keys last time, but for Clarion devs I think it's worth noting again that composite keys are defined in the fields list, not in a separate list of keys.
This still leaves some files to be created, but thankfully the remaining ones come via an existing dictionary.
How do you do that? Via the Dictionary pane. And you get to the dictionary pane like this:
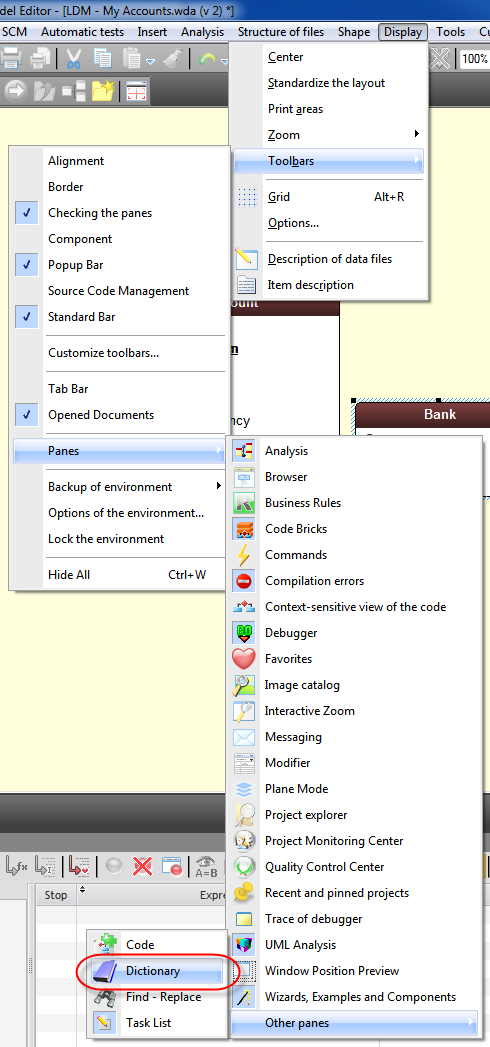
That's a fair bit of drilling.
On the dictionary pane I opened a dictionary:
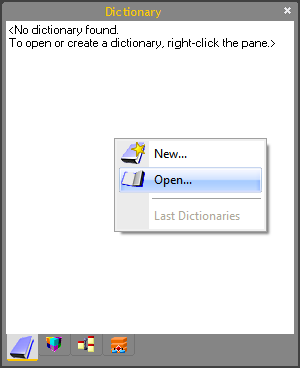
I opened the specified dictionary and then was able to drag a table from the dictionary onto my analysis window.
The final import option presented in the tutorial involved simply dragging and dropping an existing HyperfileSQL Classic (.FIC) file into the analysis using Windows Explorer.
Defining relationships
As you might expect given the graphical display of the analysis, creating the relationships is also a fairly visual process. I right-clicked on the analysis surface and selected New link....
The cursor turned to a pen shape. I clicked on Bank and then on Account and got the relationship wizard:

You can set cardinalities by buttons or by the droplist:
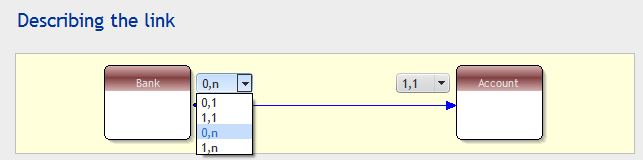
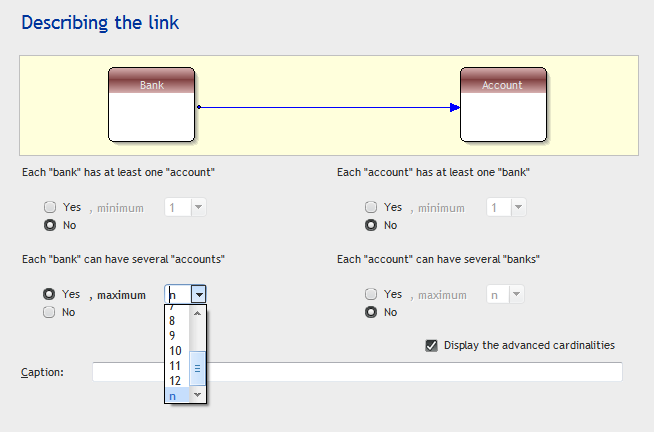
or you can enable the display of advanced cardinalities:
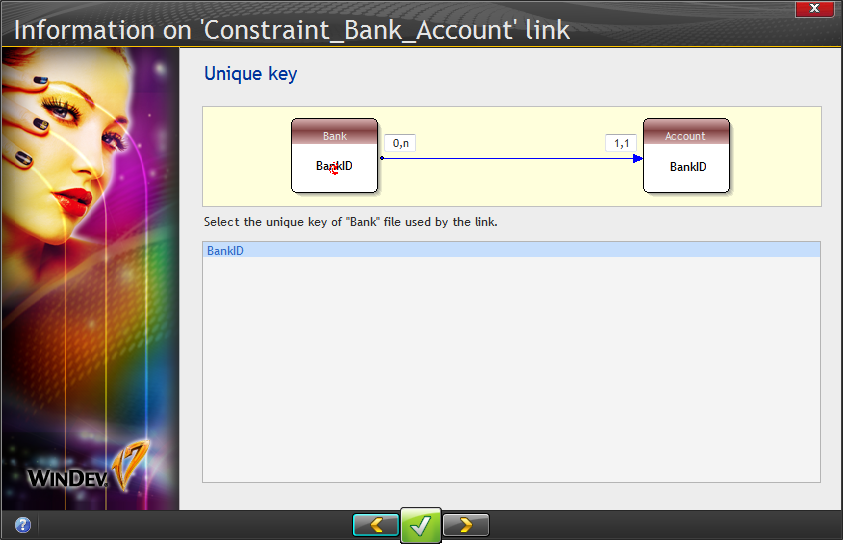
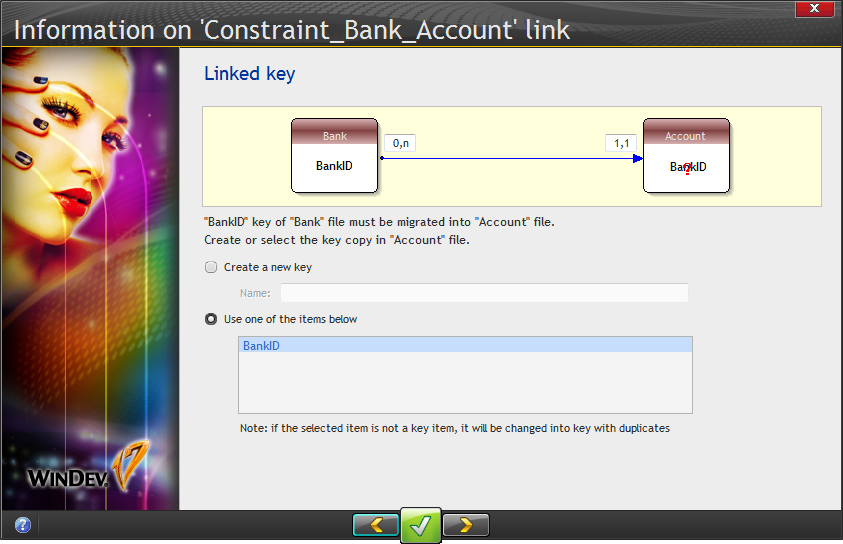
The wizard then took me through the keys to be used in the relationship:

I set the remaining relationships as specified in the tutorial.

Of note, when creating relationships if a suitable key doesn't exist, the wizard will propose and create a suitable key.
That's it for today. Next time: preparing the analysis for RAD.