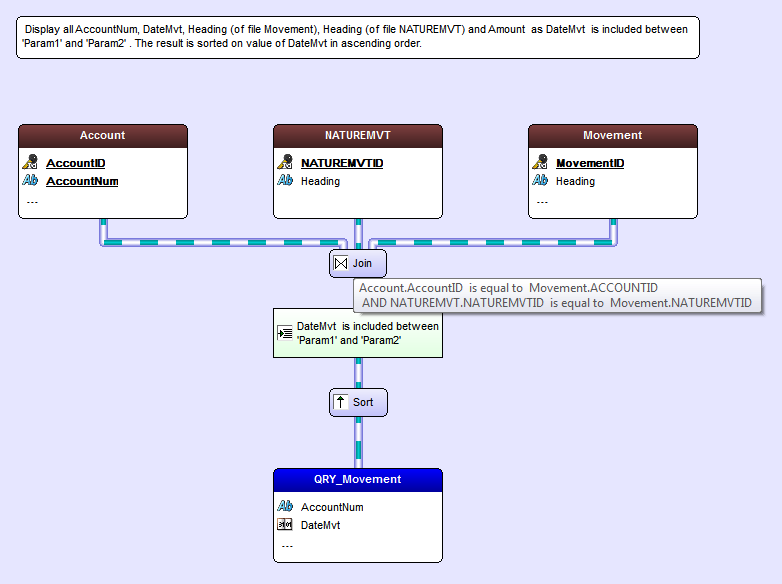
I said yesterday that I was a bit perturbed by the SQL statement which didn't show any JOIN definition. But the graphical display of the query does show the join, as defined in the analysis (I've included the tooltip in the image):

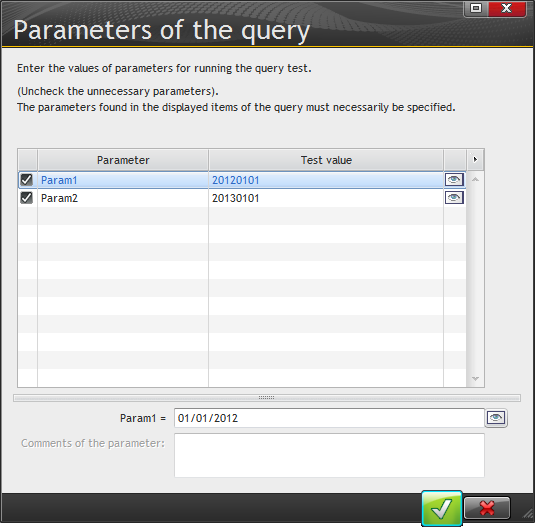
Testing the query is easy - just press the Go button. WinDev prompts for the query parameters:
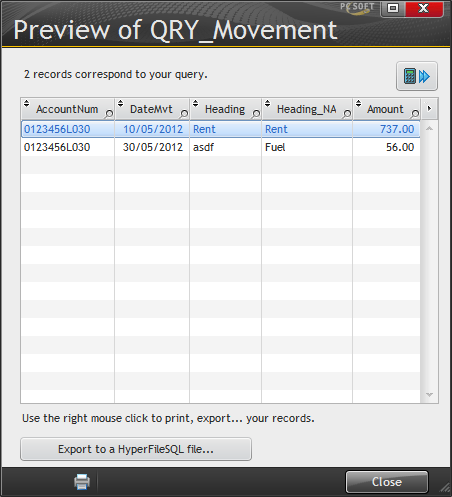
And then displays the query results:
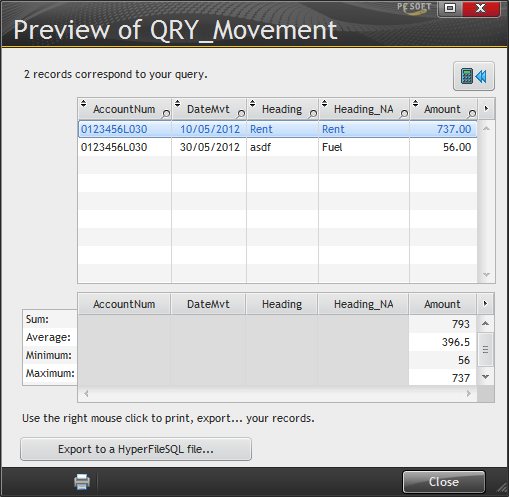
The calculator button displays sum, average, min and max for numeric results in the query:
You can also export the results to a new file:
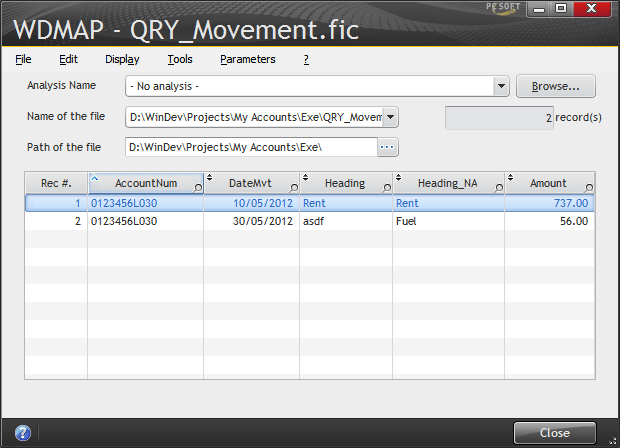
I wondered briefly if I could also use this technique to create a SQL VIEW, but it appears that this is strictly a file containing the results of the query.
Most SQL servers have the ability to create VIEWs. A VIEW is a virtual table, and your application sees it the same way it sees any other table. But the VIEW can contain fields from multiple tables, calculated values, etc. If you have a particularly complicated join or you're struggling with getting the right data, look into VIEW. |
Being able to save a query for reuse is a really nice feature. The next step in the tutorial is to create a window that uses that query.
I did that by using File | New to create a window, and then I dropped in table control. That brought up the table wizard:
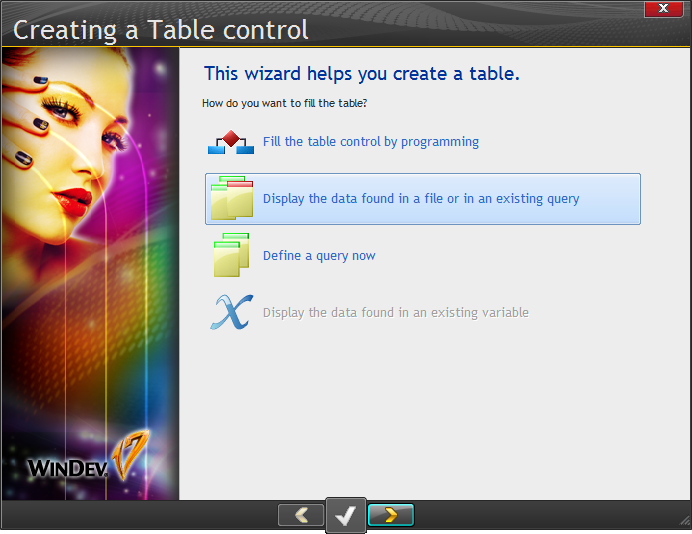
My query is listed in the available data sources (and I can filter the list by Data files or by Queries if I wish):
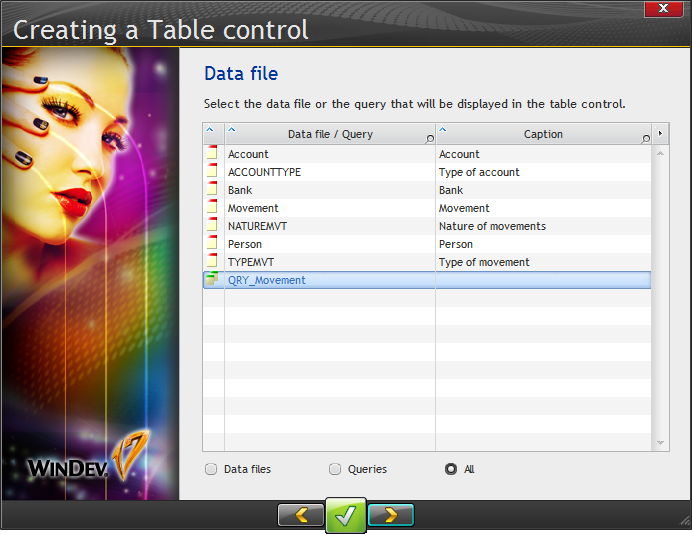
Using the wizard I selected all the query fields and defined DateMvt as the search key.
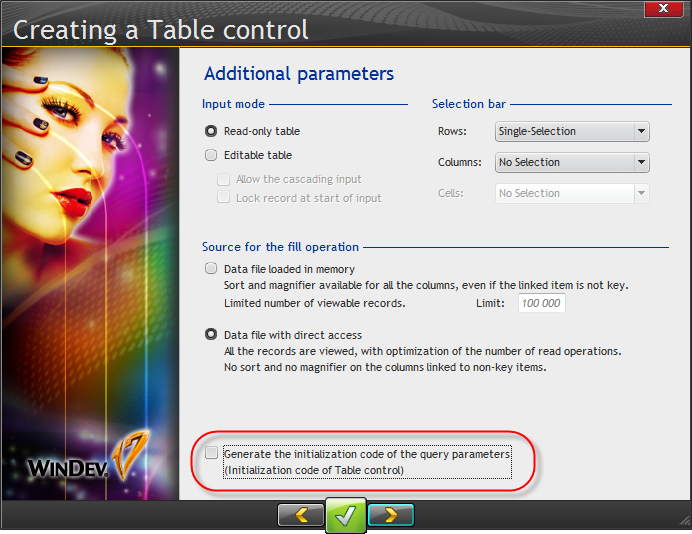
I accepted the defaults on the Additional parameters screen, except that I unchecked the initialization code generation so I could create that code myself and execute it after the user fills in the data range. Note the option for in-memory vs direct access. I'm told that WinDev doesn't do paged access by defaults (the norm for Clarion development), although you can implement this code yourself. So for large data sets you'd either want to filter the query appropriately or, if you don't actually need to see everything, limit the number of records displayed.
There's a choice of orientations. I chose Vertical:
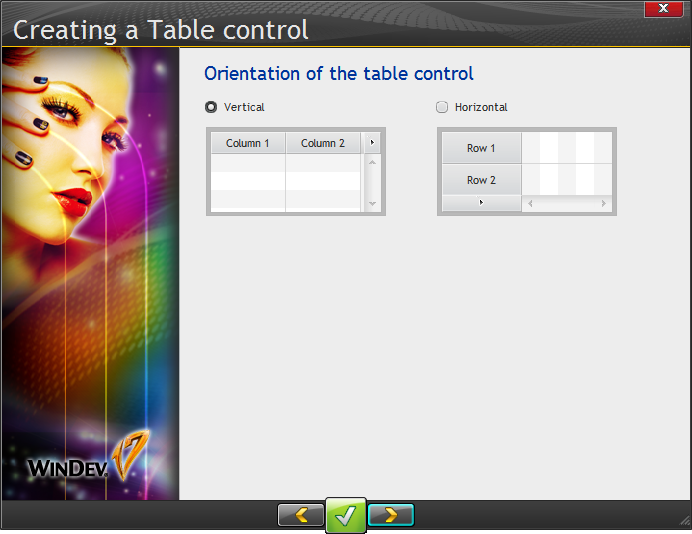
I named my table, and the wizard created it somewhat larger than my window, presumably at the size needed to display all the columns.
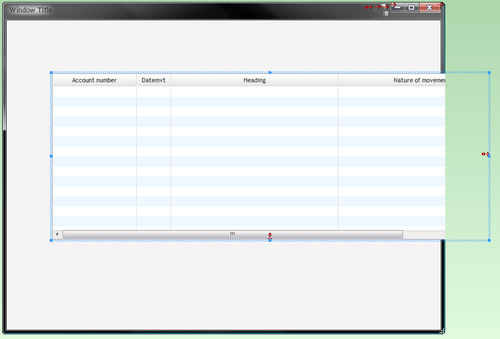
At first I tried resizing the window to contain the entire table, but the table again adjusted its position. Then I noticed the anchor markers:
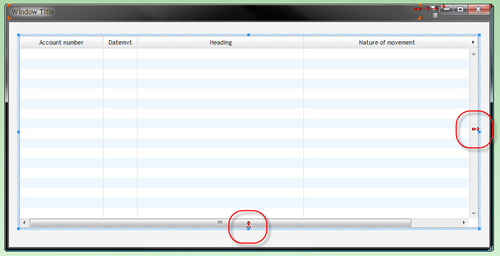
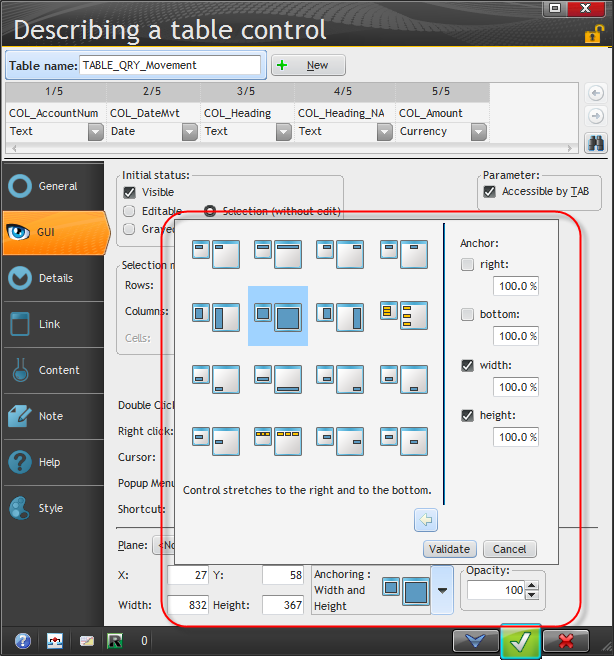
That's a nice visual cue. Anchoring settings are available on the GUI tab:
I needed to populate something called a supercontrol, available from the Wizards, examples and components pane, which can be made visible via the path down from the Display menu or by clicking on the magic wand icon.

The one I wanted was "Entering a period" which I dragged/dropped onto the window.
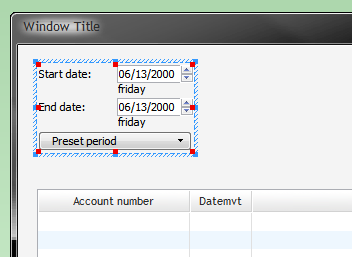
I created a button and added the following code to display the data based on the values entered in the period supercontrol:
QRY_Movement.Param1 = SC_SelectPeriod.EDT_StartDate QRY_Movement.Param2 = SC_SelectPeriod.EDT_EndDate HExecuteQuery(QRY_Movement) TableDisplay(TABLE_QRY_Movement,taCurrentFirst) |
That worked just fine, and I quite liked the preset periods drop down list.
Simple reports are available by right-clicking on the table or by using the button in the upper right-hand corner of the table:
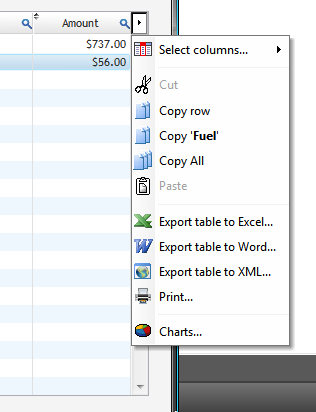
Choosing Print brings up this window:

Here's the preview from the Print directly button:
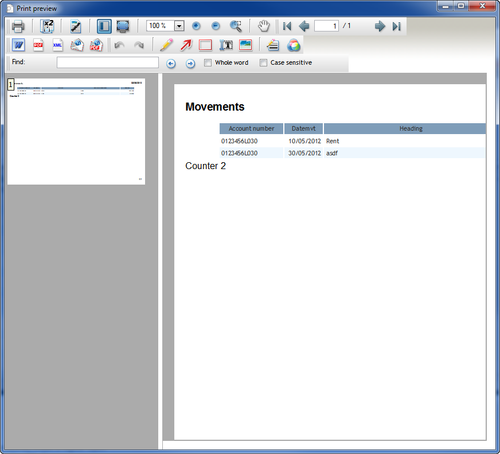
The previewer gives you the option of exporting to the standard outputs as well as printing on a printer.
The Create a report on table option only appears in development, and will (according to the tutorial) create a regular report based on the table. But when I tried this all that happened was the focus returned to the WinDev IDE. Perhaps I was doing something wrong.
However, when I followed the instructions and went to Insert | Special | Report on Table button, WinDev created a report for me:
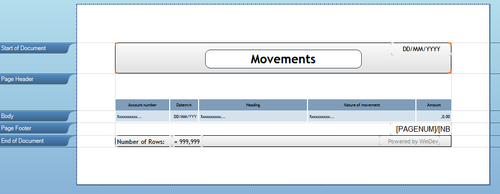
This also created a Print button on the window, which I moved to an appropriate location.
That's also the end of Lesson 2.5, so I'll save reports with embedded queries for tomorrow.