Day 049 - Getting to know the dashboard
I've passed the 400 page mark in the tutorial and I'm on the home stretch, heading into some advanced topics including:
- the dashboard
- the source code manager
- the control centers
- business rules
- external components
- project configurations
- the debugger
- the profiler
- importing/exporting projects and project elements
- installers
- UML diagrams
- modeling
- multi-lingual apps
Project management
The first step in this final tutorial section is ensuring that the environment is configured for the advanced view rather than the simplified view. You do that via Tools | Options | Options of the environment and clicking on the Restart the wizard for configuring the environment button. I never really spent any time in the simplified view so I didn't have to change anything.
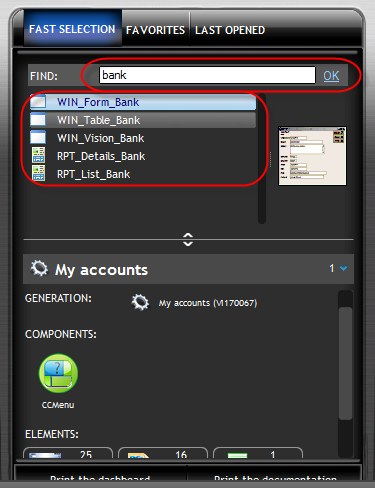
The first item, which I'd never tried before, is fast selection, a filtered list of project elements. Nice.
Favorites is pretty nice too. Click on that tab and if the list is empty there's a link to click on to add new favorites. That displays the Favorites list:
Just click the + button and a favorite will be created for the editor with focus and the element displayed in that editor. In the above screen shot I brought up a query and then clicked +. If you want to change the favorite name you must do it when you add it - at least I wasn't able to find a way to change the favorite name after the fact.
You can filter favorites in the dashboard, the same as you do for program elements. And there's something else. In the Favorites pane there's a drop list - you can switch between just your favorites and the favorites of all the developers on your team. You can also filter these lists.
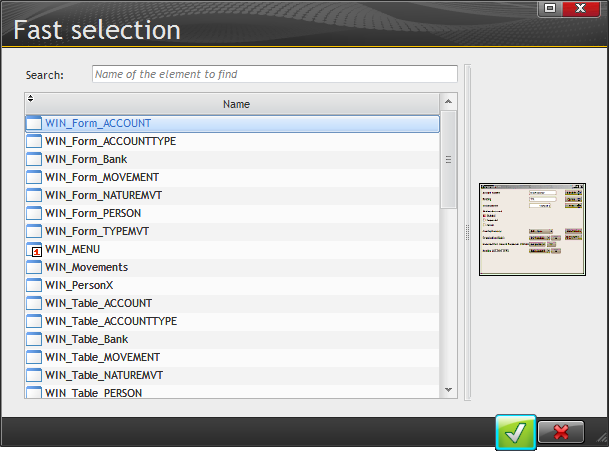
So lots of handy ways to keep track of commonly-used program elements. You can also press Ctrl-E at any time to get a fast selection popup window:
Status lights
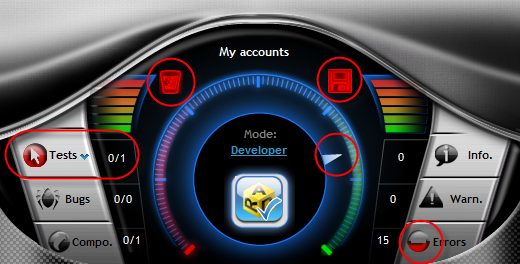
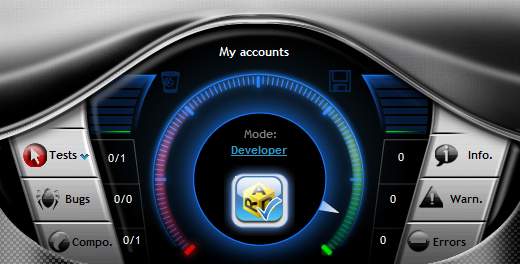
I loaded up the MyAccounts sample project, which had some compile errors. Here's what my dashboard looked like:
The speedometer-like dial indicates the overall quality of the project - here I have some compile errors and a test that has not been run.
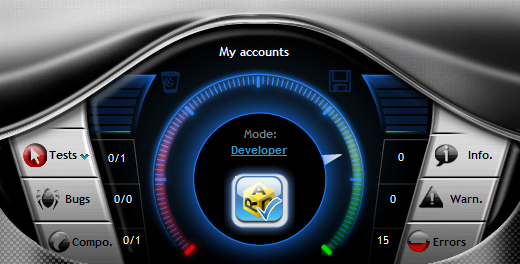
Those colored bars on either side are a bad sign. They indicate that it's a long time since my project was cleaned (left side) or saved to a backup (right side). After Performing both these actions my dashboard looked like this:
I hadn't budged the needle, however. So I fixed the compile errors (the sample app had a hard coded path to a file that didn't exist on my system, and I tried without success to run all of the unit tests. I got closer:
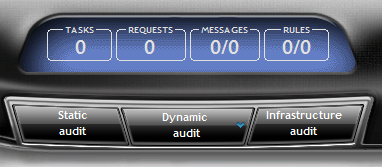
There are also some audit buttons:
The tutorial strongly advises doing a regular static audit; the button has a red light then you're overdue. Static audits detect dead code and orphaned elements and also check to see if the profiler has been run recently and whether any of your queries could benefit from optimization.
The dynamic audit looks for excessive memory use, slow algorithms, and hidden runtime errors.
The infrastructure audit it mainly for stress testing. WinDev has something called the Software Infrastructure Supervisor (SIS). You install collector agents on all the networked computers, and they all feed data to a single SIS server which then presents a statistical view of that data.
More buttons and switches!
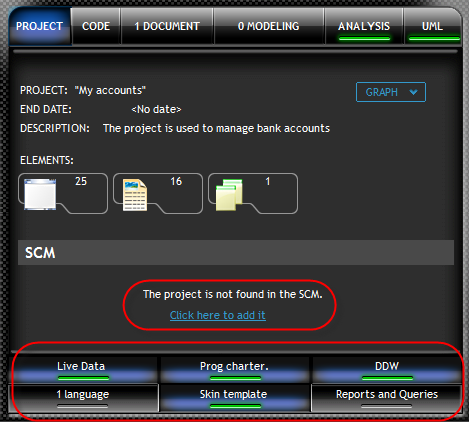
The sample project doesn't use SCM.
I clicked on the link to add the project to SCM, and that popped up a short wizard. I'd previously configured an SCM database so all I had to do was select which elements I wanted included (all of them).
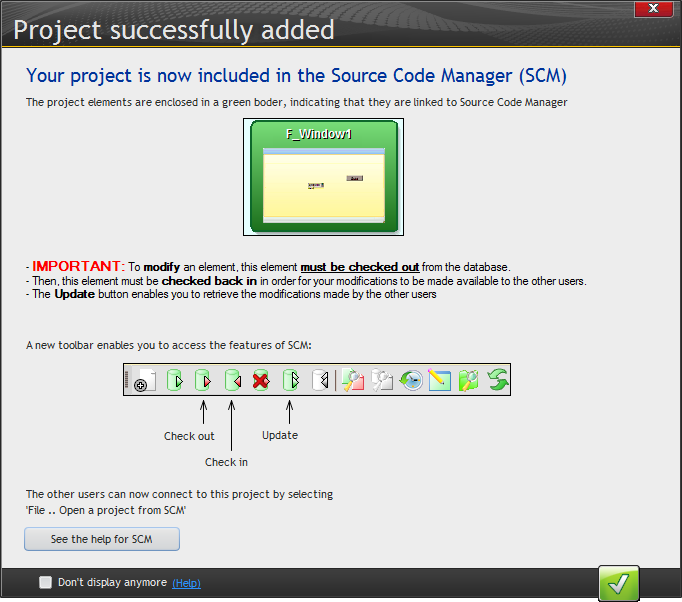
At the end of the wizard I got this window:
When I opened a window for editing I got this message:
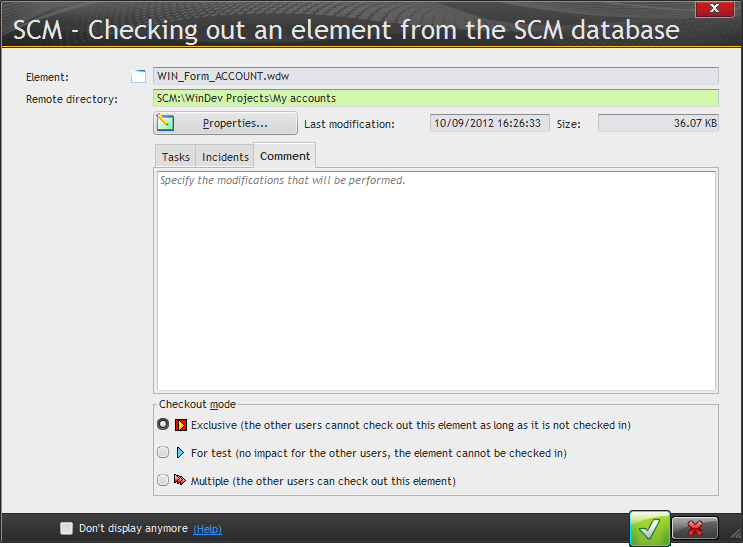
When I clicked on the check out icon I got this window:
You can hide this window so it doesn't always come up, but it's nice to have the documentation options. You may also want to leave this window displayed for a couple of other reasons:
- using alternate checkout modes (shared not exclusive, or test)
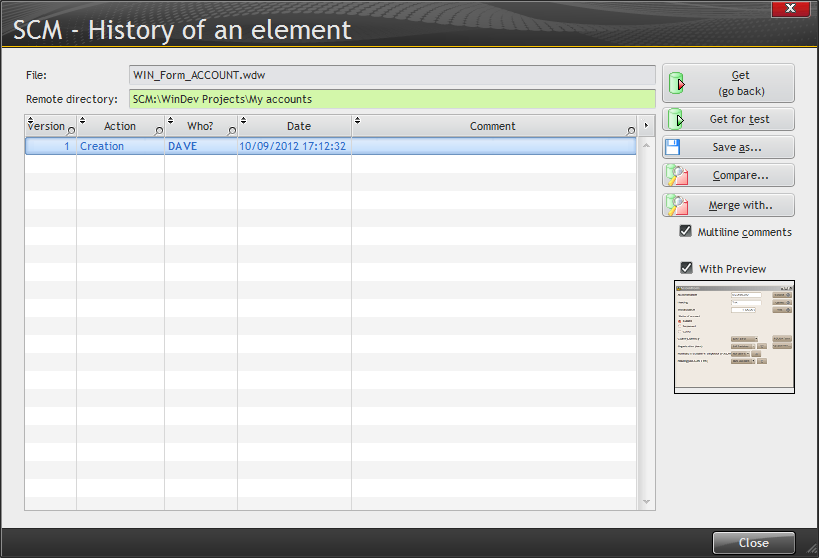
- looking at the history, which is available via the Properties button
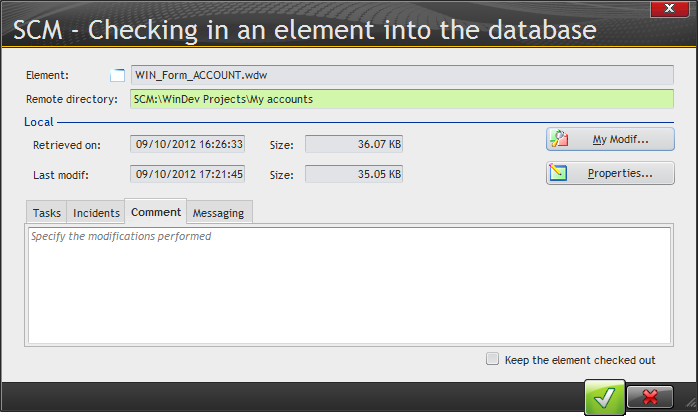
I made a minor change and checked it in:
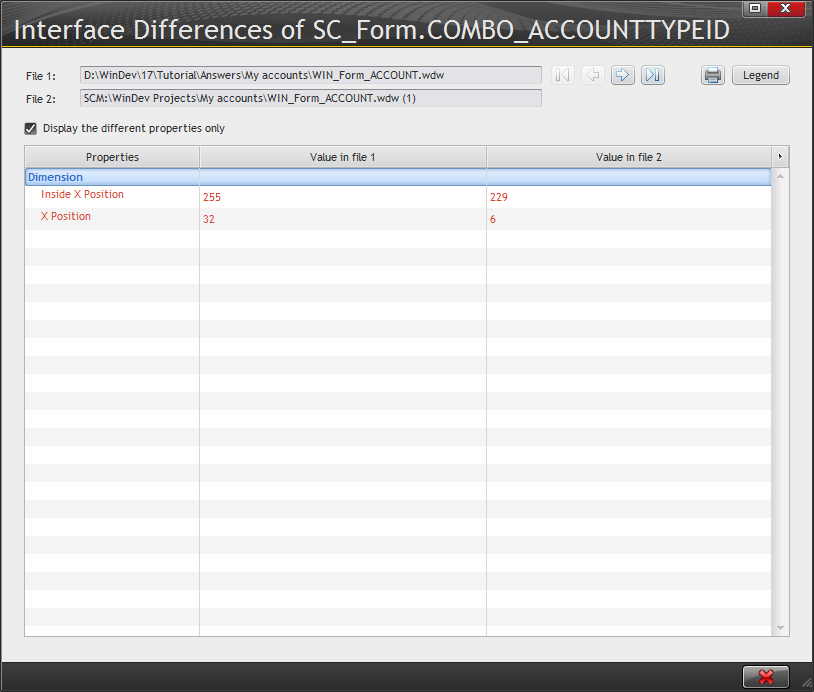
Via Properties I found my History button again and could view the changes:
I also tried to make a change to a procedure, but I didn't get a check out warning and the procedure remained read only. I'll have another look at that tomorrow.
